Stability Plot
With the Stability Plot tool (Borehole Stress > ATW Tools), you demonstrate the effect of mud weight (MW) and rock strength (UCS) on various modes of borehole failure in the Stability Plot View. Borehole failures include intrinsic breakouts, breakouts due to foliation or radial stresses.
Using the stability plot you can analyze the conditions for which various modes of compressive and tensile failures occur as a function of mud weight and UCS. Stability plots are different when At The Wall elasticity model is run using an isotropic failure model compared to using anisotropic failure mode. In the Stability Plot, an extra set of orange lines appears corresponding to the mud weights required to keep bedding-related failure to less than the specified width in degrees.
Specify Input Data
Measured Depth (MD) For the log based calculation mode selected on the Model Definition form, the input MD can be varied using the slider. The plot updates interactively as you change the MD. For depth based calculation mode, the fixed MD is displayed as input.
Uniaxial Compressive Strength (UCS) Enter the Minimum and Maximum UCS values. Min value of zero and Max value 200% of the UCS value, entered on the Rock Properties form, are set as default values. If you change the default values, use the reset  button to revert to the default values.
MD (RT) Enter the Minimum and Maximum mud weight values measured at the rotary table. The default minimum value is set to the pore pressure and the default maximum value is set to least principle stress. If you change the default values, use the reset button to revert to the default values.
Click (Re)Calculate to calculate the values based on the input data. Click Show to open the Stability Plot view.
The lock icon on the form can have different colors and states:
|
|
Open When the lock is green and in the open position, the associated algorithm is automatically executed when a change is made to the data’s input. Current status of output data is 'up-to-date'. |
|
|
Locked, No Changes When the lock is blue and in the locked position, the associated algorithm is not updated when a change is made to the data’s input. Current status of output data is 'up-to-date'. |
|
|
Open, Red When the lock is red and in the open position, the associated algorithm is automatically executed when a change is made to the data's input. Current status of output data is 'not-up-to-date', meaning the algorithm was already executed but output data was not calculated/updated due to some errors or lack of input data. |
|
|
Locked, Red When the lock is red and in the locked position, the associated algorithm is not updated when a change is made to the data's input. Current status of output data is 'not-up-to-date'. To apply the updates, you need to click the associated (Re)Calculation button. |
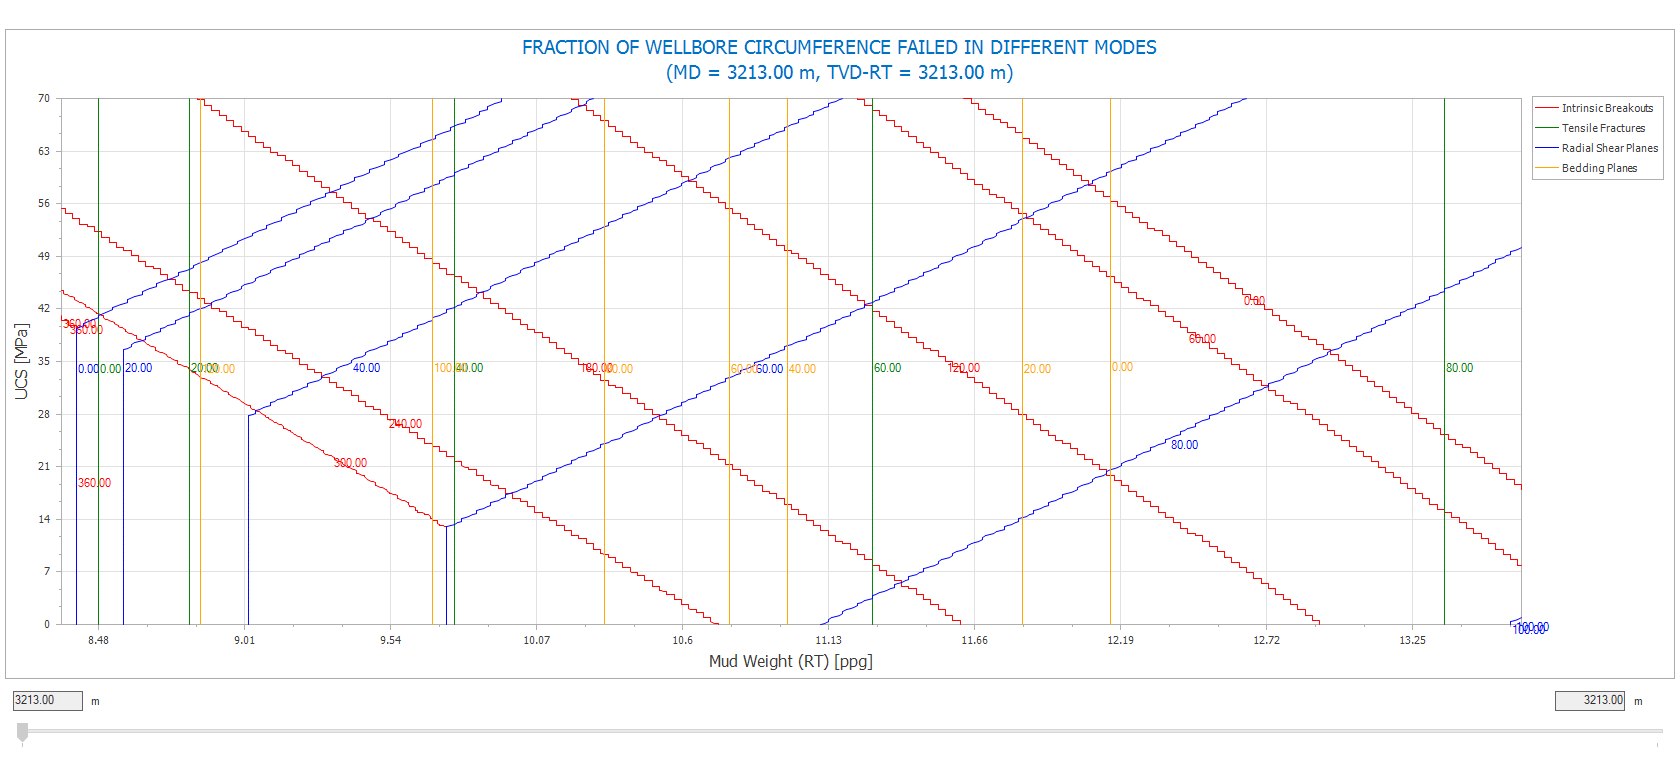
Example of a stability plot shown at fixed depth with the effect of mud weight on different borehole stresses . click to enlarge